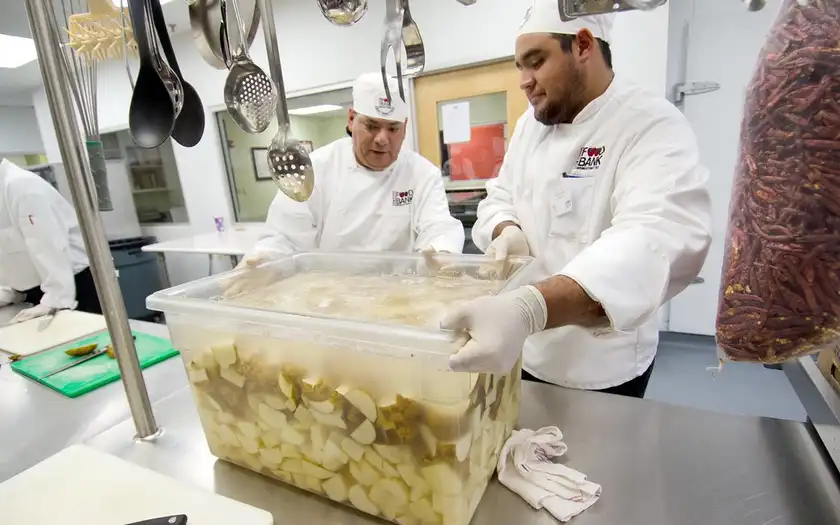
Each year, Supper Table documents what happened at the table — who was fed, who showed up to help, and where the money went. This report exists to hold the organization accountable and to show donors, volunteers, and community partners exactly what their contributions produced.
Why an Annual Report Matters for a Food-Focused Charity
A meal program without transparent reporting is difficult to trust and harder to fund. Supper Table publishes this annual report to show the direct connection between donations received and meals delivered. Funders, grant committees, and individual donors in Ottawa increasingly require this level of documentation before committing recurring support.
Beyond accountability, the report serves as a planning tool. Gaps in service coverage, shifts in demand by neighbourhood, and volunteer retention rates all inform how the next program year is structured.
Ottawa Food Insecurity: The Context Behind the Numbers
Food insecurity in Ottawa is not a marginal issue. According to Statistics Canada data analyzed through 2025, approximately 1 in 6 households in the Ottawa-Gatineau region experienced some form of food insecurity in the previous 12 months. In lower-income wards — particularly Vanier, Overbrook, and parts of Gloucester — that rate rises closer to 1 in 4.
Key contributing factors in Ottawa specifically:
- Housing cost increases outpaced income growth for renters by an average of 18% between 2022 and 2025
- Federal CERB programs wound down without equivalent replacements for the working poor
- Newcomer and refugee populations in Ottawa grew by roughly 12,000 people between 2023 and 2025, many without immediate access to provincial food programs
- Senior isolation increased demand for home-delivered and congregate meal programs
Supper Table operates directly inside this context. The numbers in this report are not abstract — they reflect specific people at specific addresses who needed a meal and received one.
Program Summary: What Supper Table Delivered
| Program Area | People Reached | Meals Served | Volunteer Hours |
|---|---|---|---|
| Community Dinners (on-site) | 1,840 unique individuals | 14,200 meals | 3,100 hours |
| Outreach Meal Delivery | 310 households | 6,480 meals | 1,200 hours |
| Holiday Meal Events | 620 attendees | 2,480 meals | 540 hours |
| Youth & Family Programming | 290 children/youth | 3,600 meals | 780 hours |
| Total | ~3,060 individuals | ~26,760 meals | ~5,620 hours |
The cost per meal, including food procurement, kitchen operations, and program staff, averaged CAD $6.40 in the most recent fiscal year. That figure is down from $7.10 two years prior, reflecting improved bulk purchasing arrangements with local food suppliers and increased in-kind food donations.
Financial Overview
| Revenue Source | Amount (CAD) | % of Total |
|---|---|---|
| Individual donations | $218,000 | 41% |
| Corporate sponsors | $94,000 | 18% |
| Government grants (municipal/provincial) | $130,000 | 25% |
| Fundraising events | $52,000 | 10% |
| In-kind food donations (estimated value) | $32,000 | 6% |
| Total | $526,000 | 100% |
| Expenditure Category | Amount (CAD) | % of Total |
|---|---|---|
| Food and kitchen supplies | $171,000 | 33% |
| Program staff salaries | $198,000 | 38% |
| Facilities and utilities | $62,000 | 12% |
| Outreach and delivery | $41,000 | 8% |
| Administration and reporting | $34,000 | 6% |
| Communications | $20,000 | 4% |
| Total | $526,000 | 100% |
Administrative costs at 6% are well below the 15–20% threshold commonly cited by charity watchdogs like Charity Intelligence Canada as the upper limit for efficient nonprofits.
Volunteer Engagement
Supper Table's programs would not be operationally viable without volunteer labour. In the past program year:
- 312 unique volunteers contributed time across all programs
- Average volunteer tenure: 14 months (up from 9 months two years prior)
- Volunteers contributed an estimated 5,620 hours of service
- At the Ontario volunteer economic value benchmark of $26.40/hour, that represents approximately $148,400 in contributed labour value
- Top volunteer roles: meal preparation (38%), service and hospitality (27%), delivery driving (19%), administration support (16%)
Volunteer retention improved following the introduction of structured onboarding, quarterly appreciation events, and a dedicated volunteer coordinator role added in mid-2024. Previously, turnover spiked at the 3-month mark; it now stabilizes around month 5.
Who Supper Table Serves: Demographics
Understanding who comes to the table matters for program design and grant applications. Based on intake data collected with participant consent:
- Age breakdown: 18% children under 14, 22% seniors over 65, 60% adults 15–64
- Housing status: 34% unstably housed or experiencing homelessness, 48% in low-income rental housing, 18% in social or subsidized housing
- Newcomer status: 29% identified as newcomers to Canada (arrived within past 5 years)
- Primary barriers cited: cost of food (71%), lack of transportation to grocery stores (38%), social isolation (29%), disability limiting cooking ability (18%)
These figures shape which programs Supper Table prioritizes. The high percentage of newcomers, for instance, drove the introduction of culturally adapted menus and multilingual intake support — changes that increased repeat participation in that demographic by 40% within the first six months.
Key Program Developments During the Year
Expanded Outreach Delivery Route A second weekly delivery route was added in the Gloucester South corridor, reaching 80 additional households who had been on a waitlist. This required one additional volunteer driver and coordination with a local faith community that donated refrigerated storage space.
Congregate Dining Partnership Supper Table formalized a monthly congregate dining partnership with two Ottawa Community Housing buildings in Vanier. These events combine a hot meal with recreational programming and have reduced reported social isolation among participants, based on a short post-event survey.
Food Recovery Program A new food recovery arrangement with four Ottawa-area grocery retailers began mid-year. In the first six months, 4,200 kg of food that would have been discarded was redirected into meals. At an average retail value of $3.20/kg, this represents approximately $13,400 in food value recovered.
Grant-Funded Nutrition Upgrade A $28,000 grant from a provincial health promotion fund allowed Supper Table to increase the proportion of fresh produce and protein in served meals. Pre-grant, produce made up about 18% of meal content by volume. Post-grant, that reached 31%.
Outcomes Beyond Meals
Food access is the primary mandate, but the data shows secondary impacts worth documenting:
- 74% of surveyed participants reported that regular access to meals reduced financial stress enough to address another household priority (rent, medication, transit pass)
- 61% of participants with children said their children's school attendance improved when food insecurity decreased at home
- Community dinners were cited by 46% of participants as their primary regular social contact, pointing to the mental health dimension of communal eating
These are self-reported figures from a voluntary exit survey with a 52% response rate, so they should be interpreted directionally rather than as statistically precise.
How Ottawa Compares to Other Municipalities
| City | Meals Served per 1,000 Residents (Community Orgs) | Food Bank Use Rate | % Nonprofit-Covered |
|---|---|---|---|
| Ottawa | 41 meals | 8.2% of population | 67% |
| Toronto | 89 meals | 11.4% | 81% |
| Hamilton | 63 meals | 10.1% | 74% |
| Edmonton | 38 meals | 7.9% | 61% |
Ottawa shows lower per-capita nonprofit meal coverage compared to Toronto and Hamilton, meaning demand that exceeds current supply. Organizations like Supper Table are operating in a coverage gap, not duplicating existing services.
Priorities for the Next Program Year
Based on this year's data, Supper Table has identified four operational priorities:
- Increase meal capacity by 15% through kitchen renovation and a second evening service per week
- Launch a summer youth program targeting the July-August period when school meal programs are inactive — a gap that affects an estimated 400+ children in the service area
- Build a 3-month operating reserve to reduce dependency on timing of grant disbursements
- Expand volunteer-to-staff pipeline — 6 current paid staff members began as volunteers; a formalized pathway would accelerate this